Skip to Main Content
It looks like you're using Internet Explorer 11 or older. This website works best with modern browsers such as the latest versions of Chrome, Firefox, Safari, and Edge. If you continue with this browser, you may see unexpected results.

Why and How To Use Gimlet
Gimlet is an electronic service that we use to keep track of reference statistics. Each question that patrons ask you must be recorded in Gimlet.
Why?
- To assess and improve, you need data!
- It takes work to get the data into shape.
- You can’t escape subjectivity...
...but you can help to manage it.
- To better fulfill our mission
- Potential cost savings, better use of staff time
|
1). Go to https://shepherd.gimlet.us/users/sign_in.
2). Log in with info provided to you by your Supervisor.
3). Consider the question you were asked and select one in each of these boxes: Type, Duration, Asked by, Format, and Location.
4). Type out the question and your answer to it. Remember to *never* use names. For students, just choose from the "Asked By" list
5). Select any pertinent tags.
6). Press the save button.
7). Make sure your question appears in the log below. You can make changes by selecting "Edit" at the upper right of the question.
|
Gimlet Features
Streamlined UI
The interface is designed for easy data capture and performance
Faceted Search
Search and drill down within your knowledge base on any page. Including reports!
Tagging
Tagging makes data entry easy and tracking service trends painless.
Date Ranges
Search or report by last week, or month, or year. Common ranges are easily entered.
|
.

|
Reports
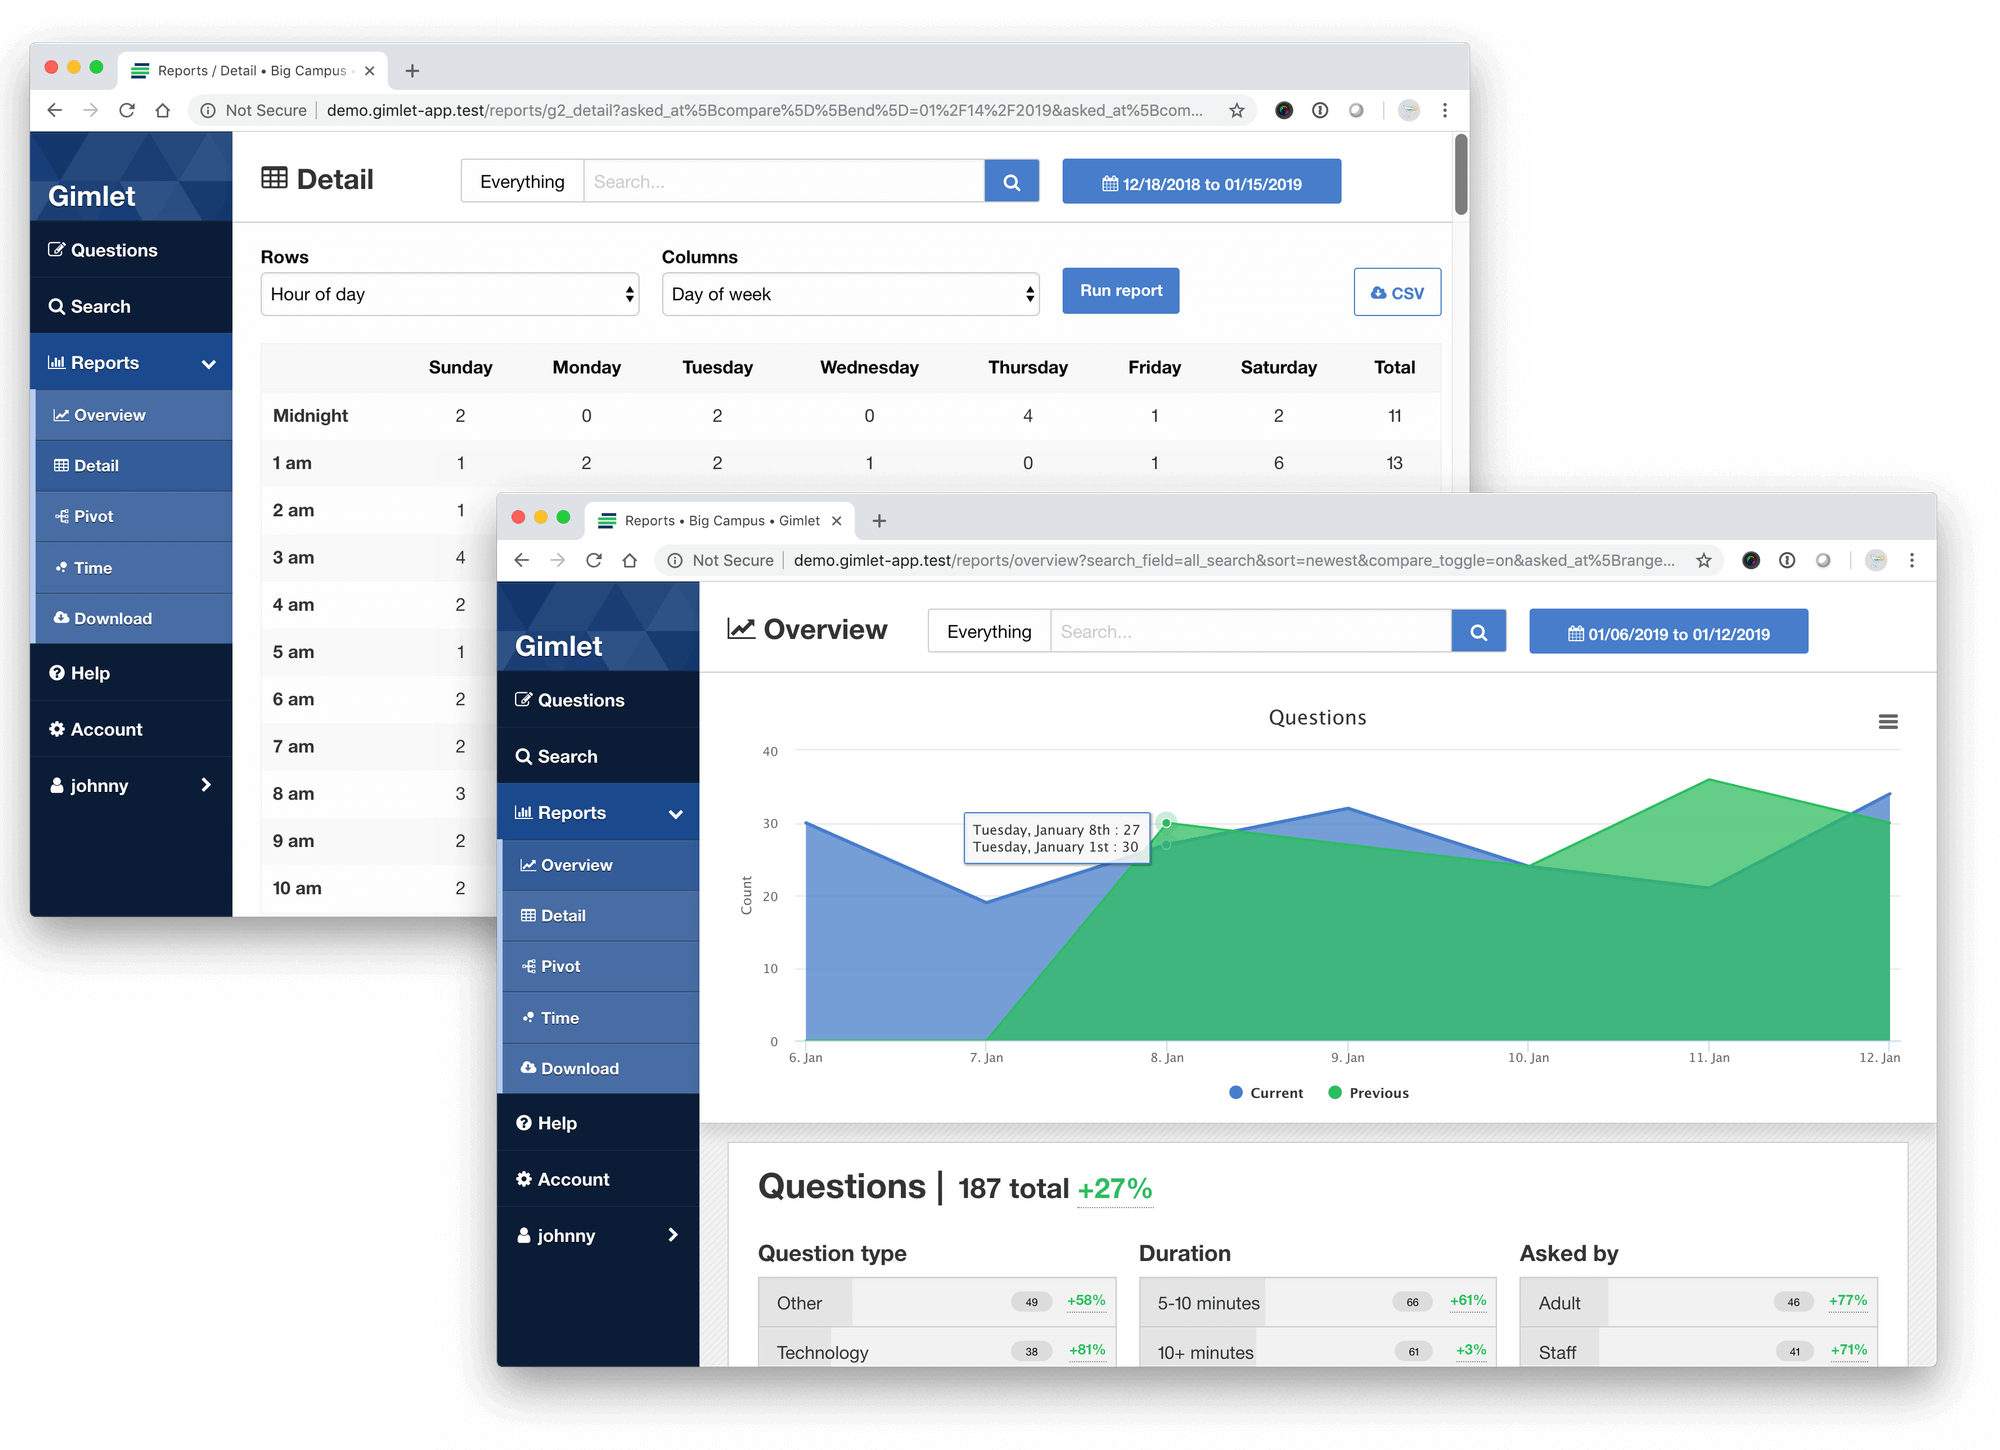
With Gimlet, we can collect reports on data as soon as it’s entered.
- Overview report
- High-level view of recent activity. See how category values are trending.
-
- Detail report
- Choose any two facets of data collected in Gimlet and run an instant pivot table report. Find your busiest times of the week, the most used tags, or who answered the most questions.
-
- Download report
- Pick a date range and return a CSV file of all the data collected during that time window. Move results into your favorite spreadsheet tool for additional local analysis.
|
 |